
Can XRP Reach $1,000? What the Market Cap Math Shows
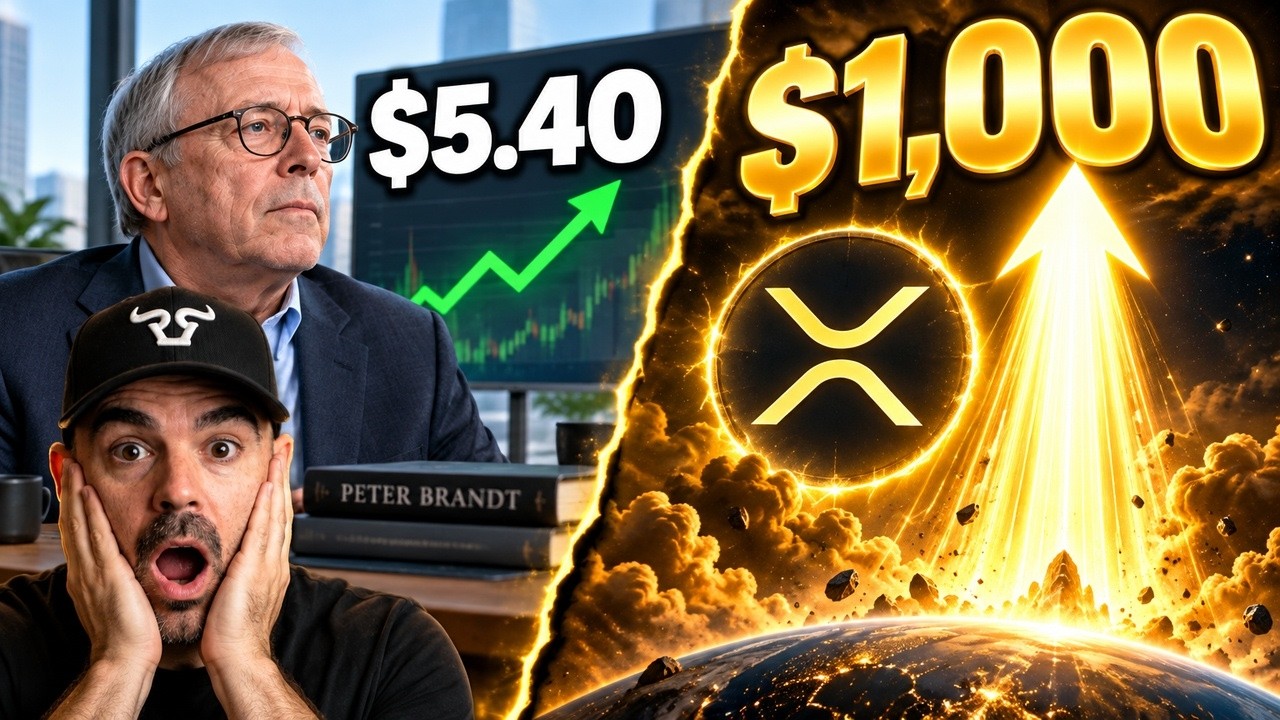
Peter Brandt's $5.40 chart and Dom Kwok's $1,000 call, tested against XRP's supply, wallet spread and Ripple's own Swift claims. Here's how the numbers compare.
Key takeaways
- You can test any price target yourself: multiply it by the circulating supply (roughly 63 billion XRP, per the video) to get the implied market cap.
- Peter Brandt's chart implies $5.40, about a $340 billion market cap. Brandt gave no time frame and said a chart post is not a trade call.
- $1,000 implies about $63 trillion on circulating supply, which the video says is nearly twice the annual output of the US economy.
- According to the video, 85% of XRP wallets hold under 1,000 XRP, while just over 2,100 wallets with a million or more control 74.1% of supply.
- On-Demand Liquidity holds XRP for only three to five seconds, which the video argues cuts against the idea that payment volume alone locks up supply.
Two public XRP price targets have been circulating: veteran trader Peter Brandt’s $5.40 and former Goldman Sachs and Blackstone banker Dom Kwok’s $1,000 by 2030. Both are real calls from credible people. The video puts each one through the same basic arithmetic and concludes that only one fits inside the market as it exists today.
This matters for holders because a price target is only a claim until you translate it into a market cap and compare it with the money that would have to exist to pay for it. Everything below is the video’s analysis and the claims of the people it quotes. None of it is a prediction.
How do you test a price target?
You multiply the target by the number of coins. The video uses roughly 63 billion XRP in circulation and 100 billion as the total supply that will ever exist. The result is the market cap the target implies, and that number can be compared with real pools of money.
| Target | Who | Implied market cap (63B circulating) |
|---|---|---|
| $5.40 | Peter Brandt | About $340 billion |
| $1,000 | Dom Kwok | About $63 trillion (about $100 trillion on all 100B coins) |
The video calls $340 billion aggressive but survivable, since crypto has absorbed valuations of that size within a single cycle. It describes $63 trillion as nearly twice the annual output of the entire US economy.
What Peter Brandt’s $5.40 chart actually says
Brandt has traded commodity markets since 1975. On September 21, 2026, he posted a monthly XRP chart showing a structure building since 2018: falling resistance from the all-time high and rising support from the 2020 lows, converging into a triangle. A breakout from that pattern implies an eventual move to $5.40.
At the time, according to the video, XRP traded between about $1.49 and $1.54, so $5.40 is roughly three and a half times that level.
Two details are often skipped:
- No time frame. Brandt attached no date and said publicly that a chart post is not a trade call and not proof he is positioned either way.
- A crowded path. The video lists the levels price would have to clear: $1.60, the 18-month moving average near $1.88, a cluster from $2 to $2.29, and then a $3 to $3.40 zone it says has capped every post-breakout rally.
The market reacted anyway. The video says XRP rose about 9% in the session after Brandt posted.
Dom Kwok’s $1,000 case
Kwok is a former Goldman Sachs and Blackstone banker and co-founder of EasyA. According to the video, he has been saying $1,000 since July 2025, including at the New York Stock Exchange, and in September 2026 called it “more likely than ever” after meetings with the White House Council of Economic Advisers and the House Financial Services digital assets subcommittee.
His argument is that market cap is the wrong constraint. He points to Bitcoin’s trillion-dollar valuation compared with legacy companies such as Walmart, and the video quotes him saying that in crypto, “a 700x is not that much.” His supporters frame XRP as a future global settlement layer rather than a speculative token.
Does Ripple’s Swift claim support $1,000?
The video tests the settlement-layer argument using Ripple’s own numbers. Swift moves roughly $5 trillion a day across more than 11,000 financial institutions in over 200 countries. At the 2025 XRPL Apex conference, Brad Garlinghouse said the XRP Ledger could handle about 14% of Swift’s volume within five years, which attorney John Deaton calculated as about $700 billion a day.
The video then runs its own version using 5% of Swift’s daily volume, about $250 billion a day, and says the implied price lands around $173. That would be a very large rise from current levels, but still far short of $1,000. The video’s conclusion is that Ripple’s most bullish public claim, executed perfectly, gets nowhere near four digits.
Who holds XRP? The wallet distribution
According to the video, there were 8,121,349 funded XRP wallets as of September 2026, growing by roughly 80,000 to 137,000 a month. Here is where holders sit:
| Threshold | XRP needed (approx.) |
|---|---|
| Top 50% of wallets | 20 |
| Top 10% | 2,120 |
| Top 1% | 44,490 (down from about 60,000 as wallets grew) |
At the top, just over 2,100 wallets hold a million XRP or more and control 74.1% of the supply. At the bottom, 4.13 million wallets hold up to 20 XRP each, and another 2.55 million hold between 20 and 500. In total, the video says 85% of wallets hold under 1,000 XRP.
Who would buy at $1,000?
This is the video’s central objection. If even a meaningful fraction of more than eight million wallets tried to sell at $1,000, the payout would run into the tens of trillions of dollars. The video argues no exchange, group of exchanges or banking system has that much ready money to absorb it, because bank money is already lent out and committed. In its words, the number is “a withdrawal larger than the vault.”
It adds a second point about how XRP is used. Ripple’s payment product, On-Demand Liquidity, holds XRP for three to five seconds: XRP comes in on one side, converts to local currency on the other, and moves on. High settlement volume means coins moving quickly through a pipe, not coins parked off the market. The video argues an asset built to pass through in seconds cannot also be a store of value for a trillion-dollar exit.
The strongest case on the other side
The video gives the bull case a fair hearing. Institutions don’t have to hold XRP to use XRP, and if demand comes from transaction flow rather than holders, the supply math becomes less of a constraint. The institutional build is real:
- Spot XRP ETFs launched in November 2025 and crossed $1 billion in cumulative inflows faster than any digital asset since the Ethereum ETFs, according to the video.
- By late September 2026, seven US spot XRP funds held roughly $1.66 billion to $1.8 billion in cumulative inflows, about 1.56% of circulating supply.
The video also flags evidence it cannot confirm, including how many of Ripple’s 300-plus institutional partners actually use the product that creates XRP demand, and notes David Schwartz’s comment that banks avoid holding volatile reserve assets.
What to check next
The practical takeaway is a method, not a number. When you see a price target, multiply it by about 63 billion and ask whether that market cap fits inside money that exists. Then watch the inputs the video points to: published wallet distribution, exchange reserves, ETF inflow reports and whether real payment volume grows. The open question the video leaves, which nobody has answered with public numbers, is whether transaction volume alone can carry a price when holders are not the ones absorbing the supply.
Frequently asked questions
Can XRP reach $1,000?
The video argues the target doesn't survive its own math. At about 63 billion circulating XRP, $1,000 implies a $63 trillion market cap, and even Ripple's most bullish Swift volume claim, run through the video's model, lands far below $1,000. This is the video's analysis, not a forecast.
What is Peter Brandt's XRP price target?
On September 21, 2026, Brandt posted a monthly XRP chart showing a triangle building since 2018 whose breakout implies $5.40. He attached no time frame and said a chart post is not a trade call or proof he is positioned either way.
How many XRP do you need to be in the top 1%?
According to the video, roughly 44,490 XRP as of September 2026, down from closer to 60,000 earlier as the wallet count grew. About 2,120 XRP puts you in the top 10%, and about 20 XRP in the top half.
How many XRP wallets are there?
The video cites 8,121,349 funded XRP wallets as of September 2026, with the count growing by roughly 80,000 to 137,000 wallets a month.
Education and commentary only, not financial advice. Crypto is volatile and you can lose money. Do your own research and speak to a qualified advisor before making investment decisions. Figures and quotes are as reported in the video on October 1, 2026 and may have changed since.