
XRP ETF Inflows vs. a Falling Price: Reading August's Mixed Signals
Spot XRP ETFs drew about $157 million in August 2026 while XRP's price pulled back. Why both can be true, who's on each side, and the signals worth watching.
Key takeaways
- Spot XRP ETFs drew roughly $157 million in August 2026, including a run of nine straight days of inflows, even as XRP's price fell about 5% in a week.
- Goldman Sachs disclosed about $86.5 million spread across five XRP ETFs.
- ETF inflows don't guarantee price gains. Spot and leveraged sellers can outweigh them in the short term.
- XRP's price has often moved closely with Bitcoin, which was struggling around $80,000 at the time.
- The signal the video watches: whether ETF money keeps coming in while the price is falling.
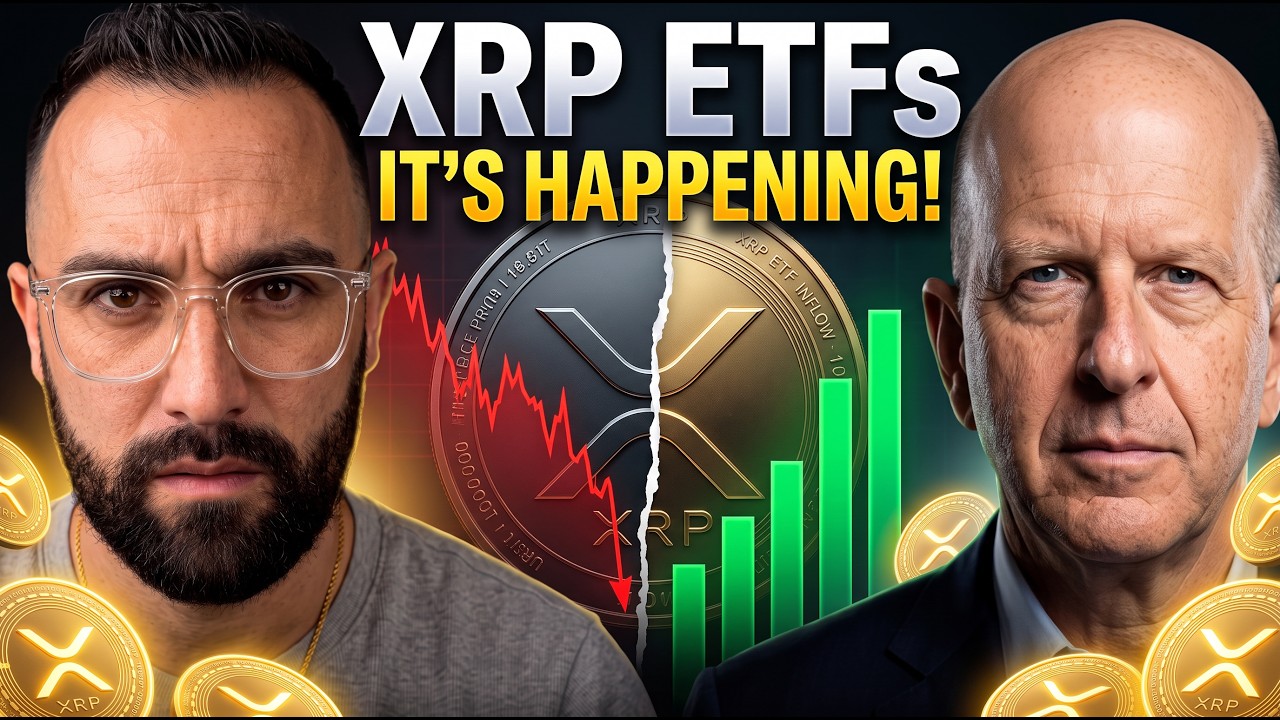
XRP’s price and its ETF flows were telling two different stories at the end of August 2026. The price was down around 5% over the past week after falling from recent highs. Meanwhile, money kept flowing into spot XRP ETFs.
That raises an obvious question: who’s wrong? Are ETF buyers positioning while short-term traders get shaken out, or are institutions buying into a market with further to fall? The video argues the answer is more complicated than “Wall Street is bullish,” and it lays out what it would watch to find out.
How much money went into XRP ETFs in August?
About $157 million, according to the video. That puts August 2026 among the strongest months for spot XRP ETFs since they launched, and the run included nine consecutive days of inflows.
The video stresses why this is different from coins moving between crypto wallets: these are flows into regulated investment products used by traditional investors. One of the largest institutions already involved is Goldman Sachs, which disclosed roughly $86.5 million spread across five XRP ETFs.
Price, despite the pullback, was still up roughly 31% for the month at the time of the video. XRP had climbed from around $1 in mid-August to about $1.70 at its recent peak, then given back a meaningful part of that move.
Why can ETF inflows and a falling price happen together?
Because ETF buyers and short-term traders work on different time horizons. A leveraged trader may care about the next 12 hours. A fund allocating to an XRP ETF may be thinking in months or years. Price can fall in the short term while longer-term capital keeps building a position.
Retail traders tend to react to the candles on a chart. Institutional allocations tend to respond to structure: regulation, liquidity, portfolio construction and long-term access. Ripple has described the arrival of XRP ETFs as a shift from quiet institutional interest toward regulated, visible access to the asset.
Do ETF inflows push the price up?
Not necessarily, and August showed it. Even with ETF demand positive, sellers were strong enough to push the market lower. According to reporting cited in the video, around $96 million in sell-side XRP volume hit Binance during the recent weakness.
The video’s summary: the real story isn’t “institutions are buying, so XRP must go up.” It’s a tug-of-war, with longer-term ETF money coming in while parts of the spot and leveraged markets keep selling.
How divided are the big traders?
Large traders were on both sides of the market. According to positioning data cited in the video:
| Position | Size reported in the video |
|---|---|
| Large leveraged long | About $38 million |
| Large short | More than 11 million XRP, about $15 million |
That’s why the video declines to call the market “universally bullish.” Some serious capital was betting on a rise and some on a fall, while ETF products kept receiving inflows. In the video’s words, the XRP market is “being fought over, not abandoned.”
How big are the XRP ETFs relative to supply?
According to the ETF data the video cites, cumulative net inflows into XRP ETFs equal roughly 1.6% of XRP’s circulating supply.
The video is careful with that number. It doesn’t mean ETFs own 1.6% of all XRP tokens in some simple sense; the reporting compares cumulative net inflows with circulating supply. But it gives a sense of scale. These products are no longer a footnote; they’re becoming a structural source of demand.
What else is moving XRP?
Bitcoin, mainly. Recent price correlations between XRP and Bitcoin have often been very strong, and Bitcoin was struggling around $80,000 at the time. So even with strong XRP ETF demand, a broader crypto sell-off could still drag XRP lower.
The video calls it a common mistake to assume a positive adoption story overrides everything else. Liquidity, macro conditions, Bitcoin and leverage all still matter, and at the end of August they weren’t all pointing the same way.
On price levels, the video says XRP was trading around $1.37 to $1.39, an area recent analysis identified as important for the August move to keep its structure. It frames this as a level analysts are watching, not a prediction.
What institutional buying does and doesn’t tell you
The video ends with a caution: don’t confuse institutional participation with institutional certainty.
- Goldman Sachs holding XRP ETF exposure doesn’t mean Goldman knows where XRP will trade next month.
- An ETF receiving inflows doesn’t mean every buyer shares the same view.
- A large leveraged long doesn’t mean that trader can’t be wrong.
What has changed, the video argues, is the structure forming around the market: regulated ETFs, institutional custody, public filings, treasury companies, stablecoin liquidity and wider access through traditional finance. None of that removes volatility.
What to watch next
The video lists four questions:
- Do XRP ETFs keep posting positive sessions?
- Does XRP hold the $1.37 to $1.39 area?
- Does Bitcoin reclaim and hold above $80,000?
- Do ETF inflows continue even if XRP stays under pressure?
The fourth is the one the video considers most telling. Buying during a rally is easy. If inflows stay positive while XRP falls or moves sideways, the divergence becomes more meaningful. If ETF flows suddenly reverse, some of that confidence was more fragile than it looked.
Frequently asked questions
How much money went into XRP ETFs in August 2026?
According to the video, spot XRP ETFs attracted roughly $157 million in August 2026, one of their strongest months since launch, with one stretch of nine consecutive days of inflows.
Why is XRP falling if ETFs are buying?
The video describes a tug-of-war. Longer-term ETF money kept coming in, while parts of the spot and leveraged markets kept selling, including about $96 million in sell-side XRP volume reported on Binance during the pullback.
Does Goldman Sachs own XRP?
Goldman Sachs disclosed roughly $86.5 million spread across five XRP ETFs, according to the video. That is exposure through funds, and the video stresses it doesn't mean Goldman knows where XRP's price is going.
What share of XRP supply do the ETFs represent?
According to the ETF data cited in the video, cumulative net inflows equal roughly 1.6% of XRP's circulating supply. The video cautions that this compares flows with supply and doesn't mean ETFs hold exactly that share of tokens.
Education and commentary only, not financial advice. Crypto is volatile and you can lose money. Do your own research and speak to a qualified advisor before making investment decisions. Figures and quotes are as reported in the video on September 1, 2026 and may have changed since.